move.kiwii.ai had just been redesigned. It is a direct-to-consumer booking site built on Vite and React, with every page prerendered to static HTML. Before the redesign, the old site's mobile home page scored 40 in local Lighthouse, the median of three runs that came in at 79, 40 and 37, with LCP at 15 s and TBT at 880 ms. My local runs throttle the CPU nine times, which is harsher than PageSpeed. After the new site went live, a PageSpeed run on the mobile home page just after midnight on October 27 came back at 37. That afternoon, with the same tool on the same page, it scored 92. Desktop held at 100 the whole way.
No single optimization did that. It took six rounds over nine days, and each round ran the same loop. Measure. Find the real cause. Change one thing. Check that nothing a visitor feels got worse. Ship it. Measure again. Three kinds of obvious fix failed that check and never shipped. More than once the score itself was wrong about what was happening. Those turns are the useful part, so this note follows them in order.
I ran the work with a small AI agent team on a client I already knew from the Kiwii pre-launch test, the one that drew 317 signups. More on how the team split the work at the end.
First, a page a crawler could read
The speed work only made sense after a September 11 health check. The old site was a client-side single-page app, so a crawler fetching it got one empty div. Of five pages, zero were readable. The first load pulled 41.5 MB, and the hero video alone was 17.5 MB.
The fix was to prerender every page to static HTML at build time and set the hero
video to preload="none". Once the pages had something to read, it was
worth asking how fast they were.
Round 1: a score the test conditions handed me
On October 18 I made two changes that left every pixel where it was. The eight benefit cards on the home page started loading lazily, which took 2 MB off the first mobile screen. The build began inlining CSS into the HTML, which removed three or four requests that had been blocking the first paint.
Local Lighthouse moved the mobile home page from 60 to 86, and LCP fell from 5.33 s to 2.43 s.
The site's cookie banner defaulted to deny at the time. A test machine is always a first-time visitor, so it never consented, and the Meta pixel never loaded. Soon after, the default changed to allow. Every marketing tag started loading, and the score dropped back into the 70s. Part of that 86 came from code that a real visitor would run and the test never did.
Round 2: putting a price on each tag
On October 22 I merged the two Google tags. Google Ads and GA4 had each been loading their own copy of gtag, and now one copy serves both.
The more useful output was a measurement. I logged how much main-thread time each third party took on the home page:
- Facebook, 970 ms, from two Meta pixels
- Google, 625 ms
- Klaviyo, 464 ms
The second Google tag had looked like the culprit. Meta's two pixels cost more than all of Google's code put together.
Round 3: the subtraction table
The redesigned site went live on October 23, and on October 25 I audited every page. On desktop, all 11 pages scored 100. On mobile they ranged from 67 to 78.
To find out who was slowing the mobile home page, I removed one thing at a time and measured again:
| Condition | Score | TBT |
|---|---|---|
| As live | 67 | 1,469 ms |
| Second Meta pixel removed | 69 | 1,067 ms |
| All of Meta removed | 78 | 516 ms |
| Every third party removed | 87 | 99 ms |
That table answered a question a Lighthouse suggestion list never could. It shows who is slowing the site and by how much, in the site's own numbers.
The same audit turned up a handful of small fixes, and they shipped together on October 26. The two lines of the home page H1 were missing a space between them. The hero poster had no dimensions. The site got its own 404 page. Mobile CLS on Privacy and Terms went from 0.19 and 0.15 to 0.
Two more changes made the score look better and still got pulled. Stripping CSS the home page didn't use and deferring scripts later in the load both nudged the number up. On a slow phone, though, buttons became tappable 0.2 to 2.4 seconds later. I had set how soon a button responds as a hard floor, so both changes came out.
Round 4: a 58 that wasn't the video
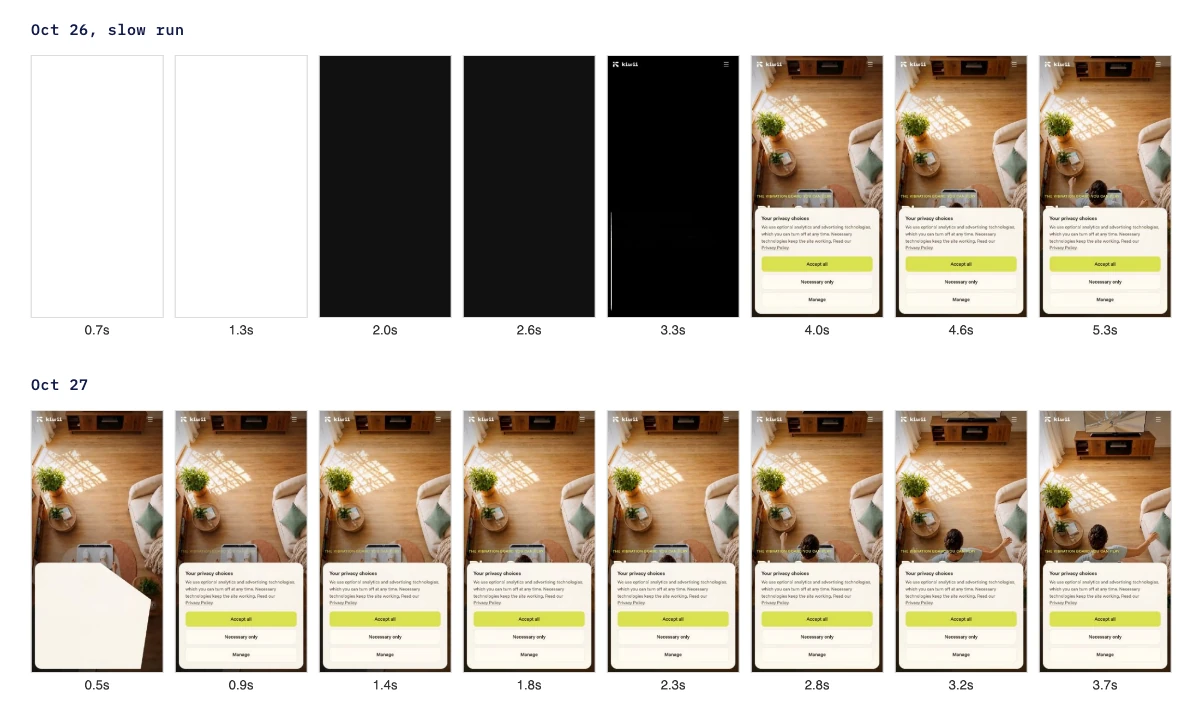
Late on October 26, after those fixes went live, PageSpeed scored the mobile home page at 58. FCP was 3.9 s, LCP 10.6 s, TBT 250 ms and Speed Index 5.8 s. The hero video was the obvious suspect, and it was innocent. The real cause was ordering. Every so often the browser finished running the site's own scripts before it painted the first frame.
My local runs caught the same slow start that night. Two local runs after the fixes went live scored 34 and 62. In the 34, the first paint slipped to about 4 seconds and LCP to 12.47 s.
The fix kept the scripts downloading early through modulepreload and
held their execution until after the first frame was on screen. In the same round,
the game poster got 480 px and 640 px versions for phones. That took 0.4 MB off the
mobile home page, at an SSIM of 0.94 to 0.98, which no one can see.
I also tried compressing the hero video and posters, and measured the result with VMAF and SSIM:
| Version | Size | VMAF |
|---|---|---|
| Original | 3.48 MB | 75.2 |
| crf 30 | 2.53 MB | 72.4 |
| crf 33 | 1.79 MB | 67.7 |
By the point the file got small enough to matter, the wood grain, the fabric and the hair had gone soft. The video stayed as it was.
Before this round shipped, it had to clear the floors. Button response was measured against the live site in 48 alternating runs, which caught one slow case that was then fixed. Ten pages were compared with the live site text node by text node, and they matched exactly. All 11 functional checks passed.
Round 5: the 37 my laptop couldn't see
Round 4 went live at 12:19 a.m. on October 27. Ten minutes later, before Round 5 shipped, PageSpeed came back with 37 on mobile. FCP was 2.3 s, LCP 7.0 s, TBT 1,700 ms and Speed Index 13.4 s, with forced reflow at 1,524 ms. Local Lighthouse gave 87 to both the old version and the new one.
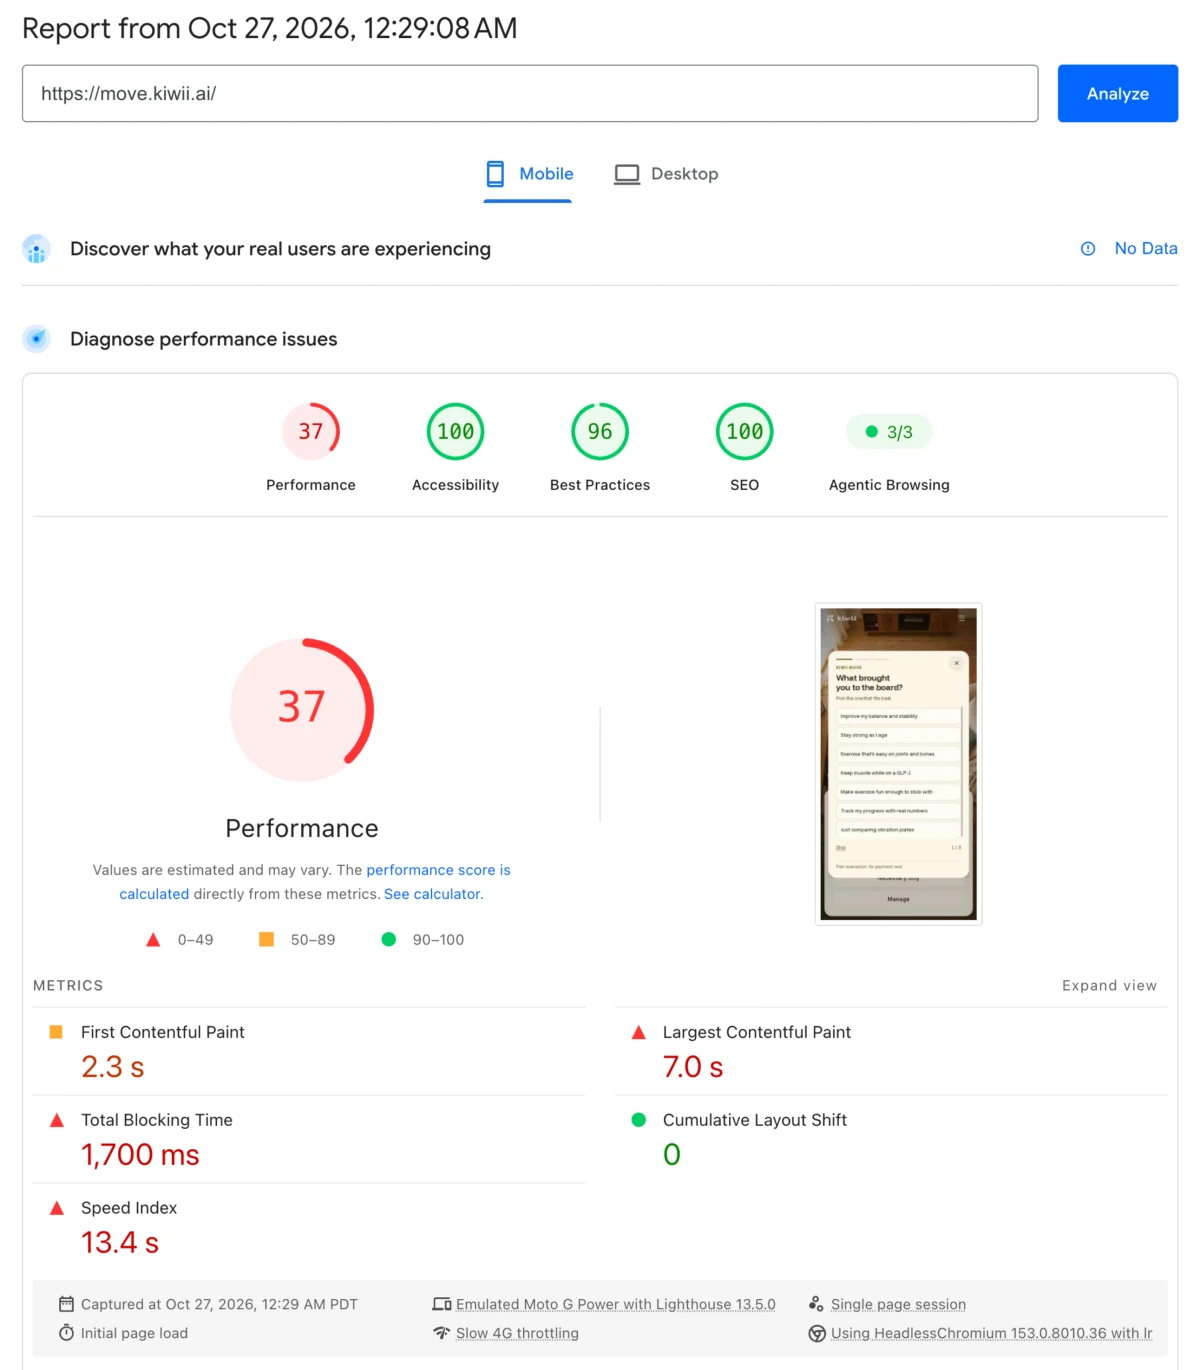
Three animations on the home page were running every frame from the moment it opened, whether or not they were on screen. They were the card parallax, the marquee and the SVG animation in the Benefits section. Every frame, each of them forced the browser to lay out the whole page again.
A local Lighthouse run records about one second of activity, and this cost builds up over time. PageSpeed's slower run records more than ten seconds, long enough for it to show. I only got the full picture from a 15-second Performance trace.
The fix made the parallax calculate only while the page scrolls. The marquee and the animation now pause when they leave the screen and resume when they come back. Sitting on the home page for 15 seconds, before and after:
| Measure | Before | After |
|---|---|---|
| Main thread busy | 9,387 ms | 1,707 ms |
| requestAnimationFrame callbacks | 1,770 | 0 |
| Forced reflows | 1,775 | 6 |
The floors held here too. The parallax was compared frame by frame at seven scroll positions, and every value matched. The marquee ran at 35.96 px/s before and 35.95 px/s after.
A business call: switch off the Meta pixel
On the afternoon of October 27, with no Meta campaigns planned for now, I paused Meta's three tags in GTM. Google and the email tool stayed exactly as they were. In the subtraction table, that is the row where removing all of Meta took the home page from 67 to 78.
Tracking code has a performance cost. If nothing is using a tag, switch it off and turn it back on when a campaign needs it. I made the same call on this site, which runs no analytics at all. When I tested Microsoft Clarity on it, mobile performance fell from a range of 88 to 94 to a range of 64 to 67, and LCP went from 2.3–2.7 s to 5.5–6.4 s.
Round 6: a lighter home page
On the afternoon of October 27 the sections below the first screen got
content-visibility: auto, so the browser renders them only as a visitor
scrolls close. The number of elements the browser lays out when the home page opens
dropped from about 1,274 to about 475.
The survey pop-up used to open after eight seconds, even if the visitor hadn't scrolled. Now it waits until they scroll past the first screen. My inference, which no test has proven, is that PageSpeed's slow run recorded past the eight-second mark. The pop-up and its overlay would then change the whole frame at once and push Speed Index up.
Measured locally, main-thread time went from 1.3 s to 0.85 s and TBT from 104 ms to 73 ms. Button response stayed within the floor across 12 alternating runs. One more round of style removal would have slowed buttons by 0.2 s, so it came out too. I measured this round's own gains locally.
Where it landed
The Meta tags were paused at 3:17 p.m. on October 27, and Round 6 went live at 3:45 p.m. Three minutes later I ran PageSpeed on the mobile home page again. It scored 92, up from 37 just after midnight.
| Metric | Just after midnight | Afternoon |
|---|---|---|
| Performance score | 37 | 92 |
| First Contentful Paint | 2.3 s | 1.8 s |
| Largest Contentful Paint | 7.0 s | 2.7 s |
| Total Blocking Time | 1,700 ms | 80 ms |
| Cumulative Layout Shift | 0 | 0.001 |
| Speed Index | 13.4 s | 4.5 s |
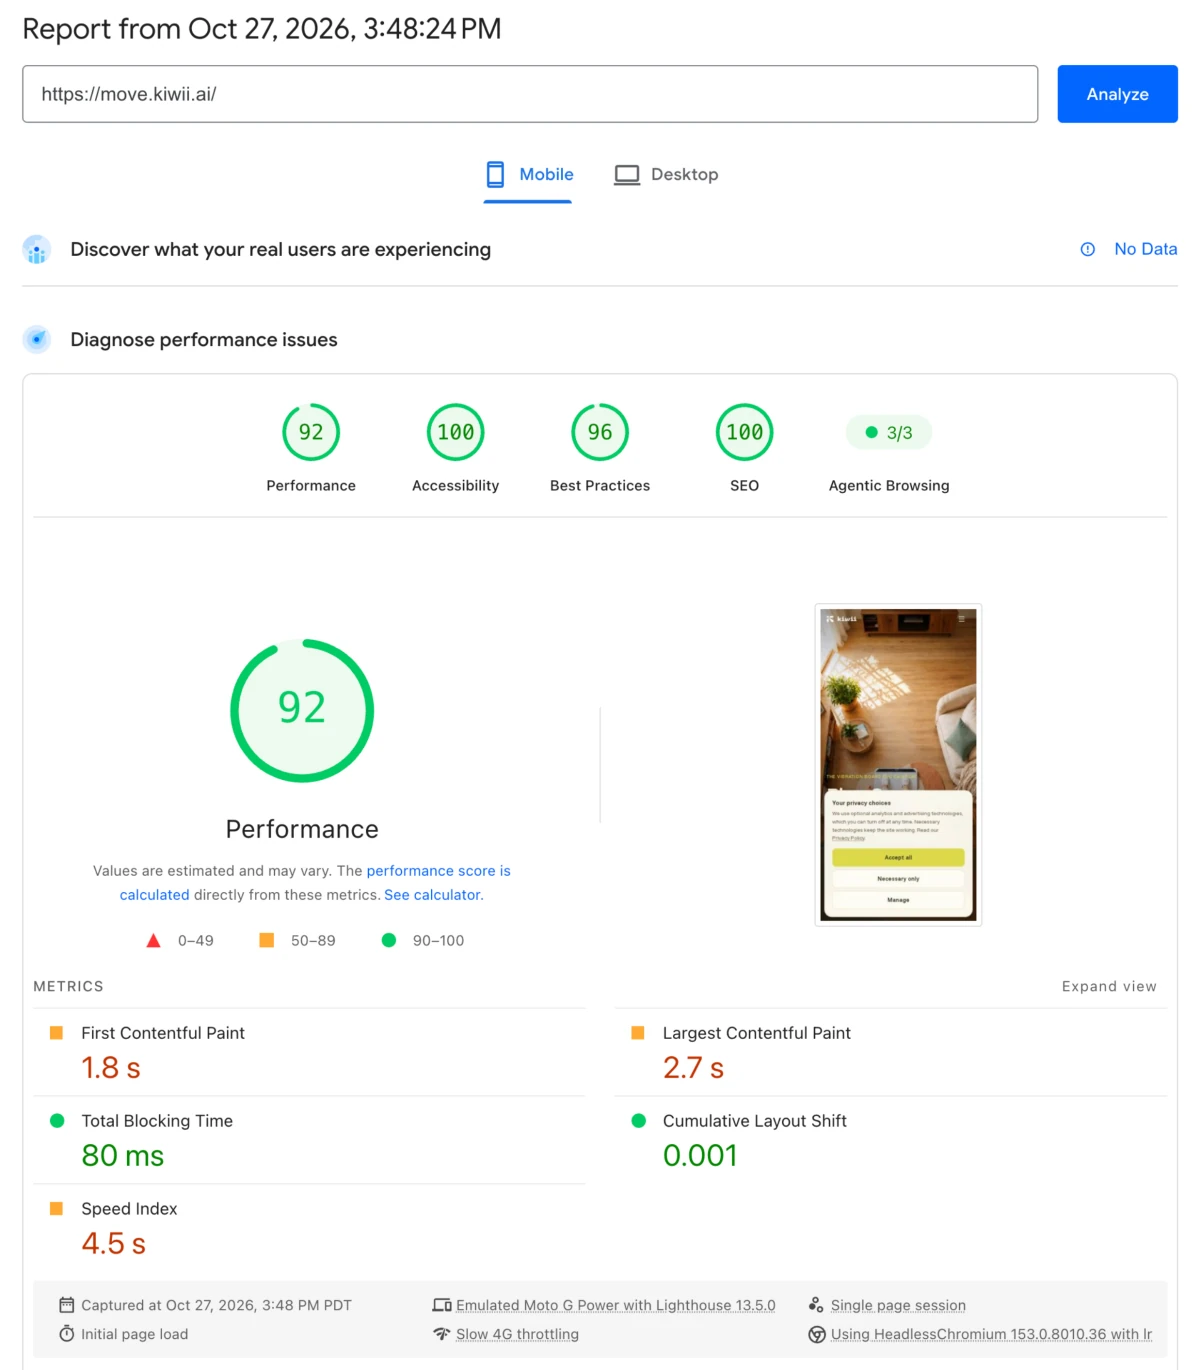
Accessibility and SEO scored 100 in both runs, and Best Practices 96.
PageSpeed and my local Lighthouse runs measure differently, so I keep them as two separate lines. On the local line, with the same 9× CPU throttle every time, the October 25 audit scored 69 with TBT at 1,172 ms. That evening, with every round live and Meta paused, five runs gave a median of 80, in a range of 78 to 82, with TBT at 448 ms. Measured the same way from the old site's 40, that is 40 to 80. Desktop re-tested at 100, with LCP at 0.62 s and TBT at 9 ms.
What I'd tell a peer
Find out who is slow before you change anything. Remove one thing at a time and measure. The subtraction table did more for this site than any list of Lighthouse suggestions.
Set the experience floors first. Mine were three. Buttons respond as fast as before, the page text stays word for word the same, and images and video show no visible loss. Those floors vetoed the CSS removal, the deferred scripts and the video compression, all of which would have raised the score.
Assume the test conditions are lying to you. With cookies defaulting to deny, the marketing tags never loaded and the score came out inflated. Local Lighthouse records about a second, so it misses animations that run forever. A single PageSpeed run can swing, and that 58 was one slow run. Alternate several runs before you believe a number.
One change per commit, preview before release, re-test on the live site. That way every release can be rolled back on its own.
On the team: one AI session acted as the brain. It split the work, checked each result and held the floors. A separate website agent changed the code and ran the tests. I made the decisions that belonged to the business, such as switching off Meta, changing when the survey appears and leaving the video alone.