AdRadar labels one rival's ads on one platform, then reads the strategy off the labels
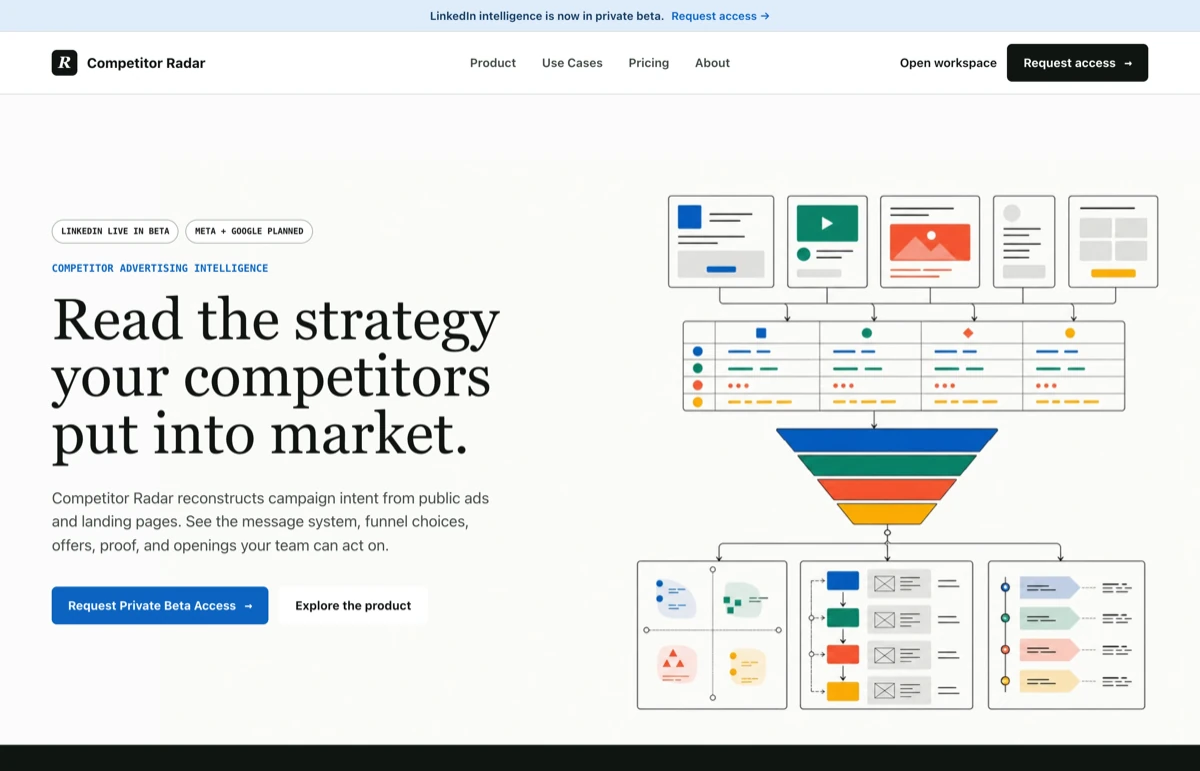
Cross-platform competitive intelligence for teams competing in many markets at once. It collects LinkedIn, Meta and Google ads from the public transparency libraries. AdRadar labels each creative and landing page for funnel stage, offer, audience and claim, then reads the strategy per market, per platform and across all three. Today I label LinkedIn. Meta and Google are collected, and I have not run the extraction pass on them.
Competing globally against companies that outspend you in every market
At PingPong we competed with enterprises running paid programs in dozens of countries at once. For a performance marketer, knowing what those companies are doing is not optional. It sets your positioning, your budget split, and the markets you can realistically win.
The information was public and still unusable. A single competitor had hundreds of live creatives across LinkedIn, Meta and Google, in market after market. Opening an ad library gives you a scroll of cards with no country cut, no funnel read, and no way to see how the three platforms divide the work between them. I read forty cards by hand once and stopped, because forty cards out of several hundred is an anecdote.
Two views were missing and both mattered: what a competitor runs in one country, and how their channels coordinate across all of them.
LinkedIn, Meta and Google each publish their own, in their own format, with no shared competitor record between them.
3 tabs, no exportOne creative at a time, in the order the library feels like showing them. No country cut, no funnel read, no way to sort by anything that matters.
~40 read by handMessage, offer, destination and market, keyed in by hand, with the categories invented differently every time somebody new does it.
an afternoonA single competitor was running several hundred live creatives. Any read off the fraction you managed to log is a guess wearing a spreadsheet.
no defensible answerAd-intel suites, a chatbot, and an afternoon of scrolling
Three options were on the table before I built anything. Each one was good at a question I was not asking.
Broad creative capture with format breakdowns and spend estimates, packaged for an enterprise buyer.
Priced for a team that already has a research function, uneven coverage outside the US, and it reports format rather than intent. Format tells you a rival runs video on Meta. Intent tells you Meta is carrying their conversion load.
RejectedThe source of truth, free, current, and legitimate to read. Every live creative a competitor is running.
Built for disclosure rather than analysis. One card at a time, no country cut, no funnel read, and nothing that survives being closed.
Kept as inputA sharp read on any single creative, instantly, with no setup and no cost worth counting.
No memory of the other three hundred. It answers what one card says, and the question was what the set does.
RejectedAll three read creatives one at a time, and strategy only exists in the aggregate.
Label every unit, then let the aggregate speak
The idea came from Snorkel and programmatic data labeling. If you can label a corpus cheaply and consistently, the labels themselves become the dataset you reason over. An ad library is a corpus nobody had labeled.
So the pipeline works bottom up: a small model answers one narrow question at a time about one ad, and those answers add up into the picture of a competitor. Everything the tool claims at the top is traceable to labels at the bottom.
Each creative and its landing page go to DeepSeek: funnel stage, offer type, audience, claim, proof used. Cheap enough to run on the whole set rather than a sample.
Labels roll up per placement and per country, which is where a real pattern first shows: the same brand runs a different funnel in Germany than in Singapore.
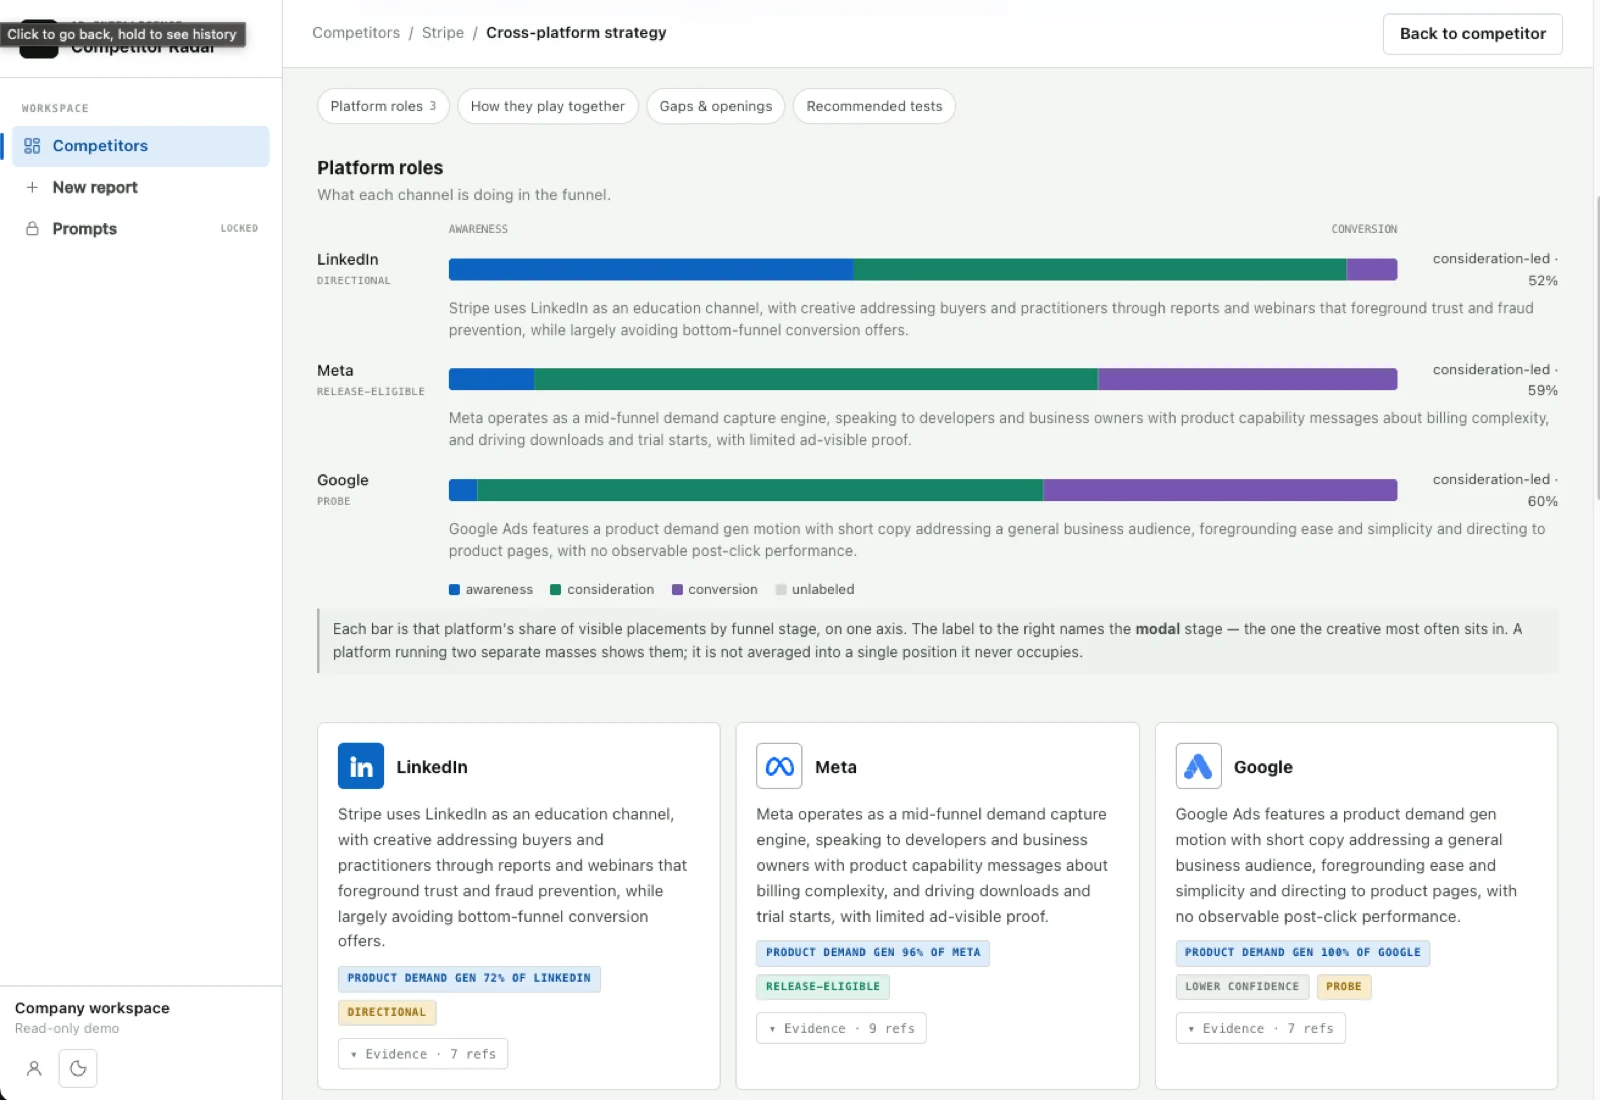
With clean labels underneath, a stronger model reads one platform at a time and states the role it plays, backed by counts instead of impressions.
The top layer compares the three and reports how they divide the funnel, what repeats everywhere, and where the gaps are.
Sources are the platforms' own transparency libraries, which exist so anyone can inspect what is running. I touch nothing private and estimate no spend.
A cheap model for every ad, an expensive one for the plan
Cost decides whether you label everything or a sample, and a sample is what makes competitive research wrong. Labeling runs on DeepSeek at a price that lets every creative through. Only the synthesis layers, where reasoning pays, run on a frontier model.
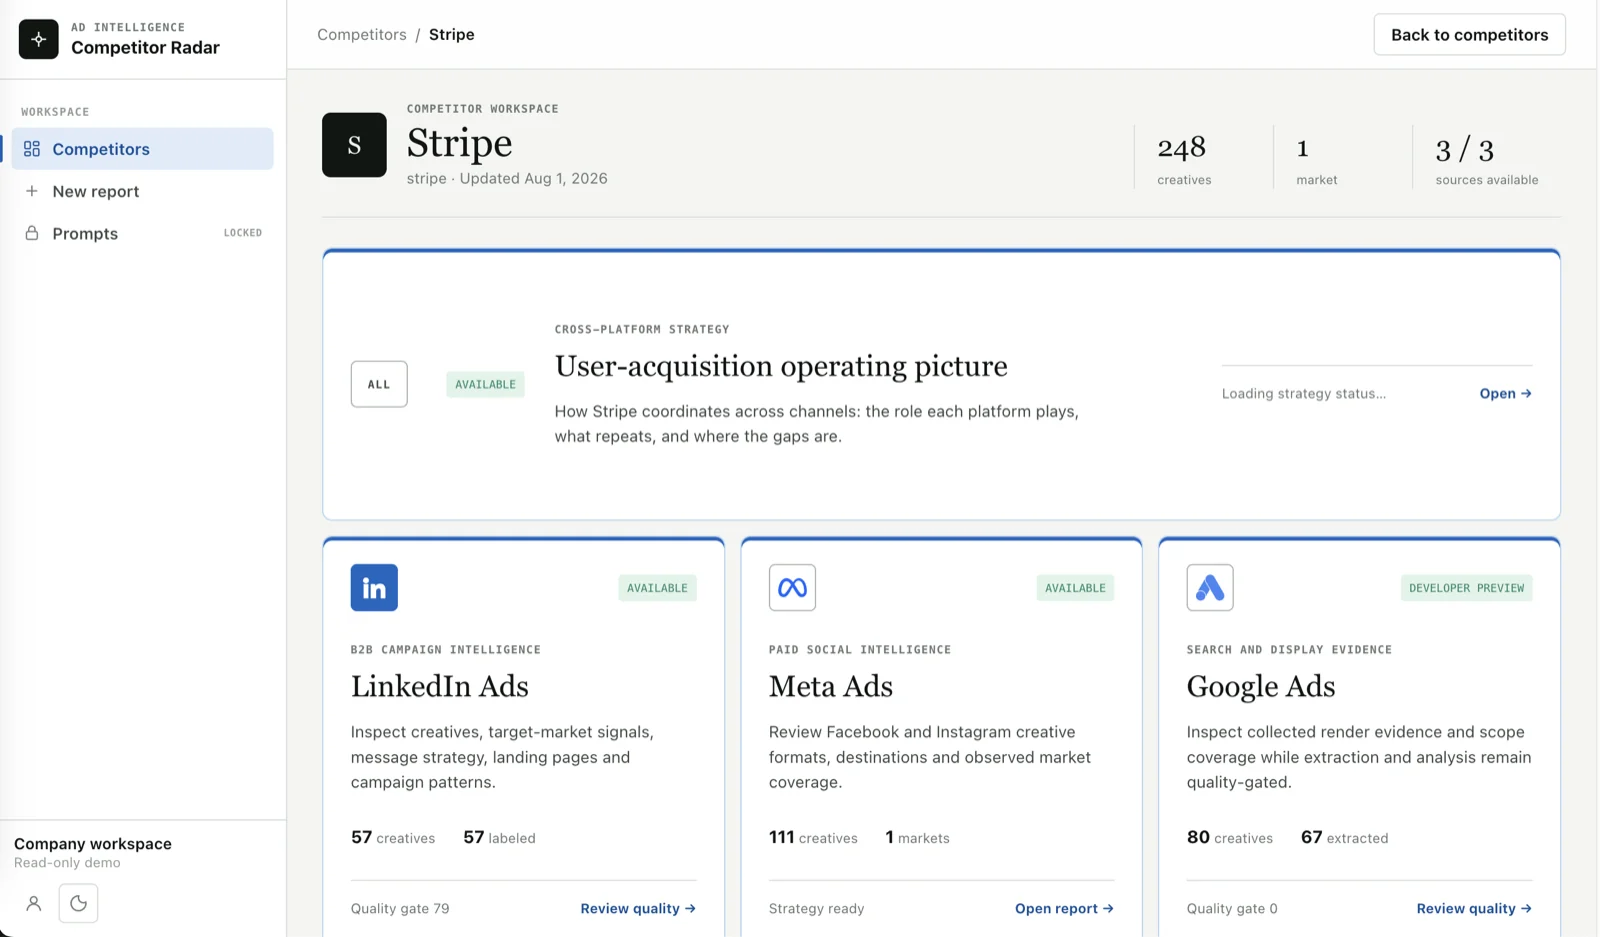
Each platform carries a quality gate, because coverage differs by source and a confident report over thin data is worse than no report. The workspace shows how much each source collected, how much it labeled, and where coverage is still short, so the analysis stays honest about its evidence.
Four questions, asked today on the platform that is labeled
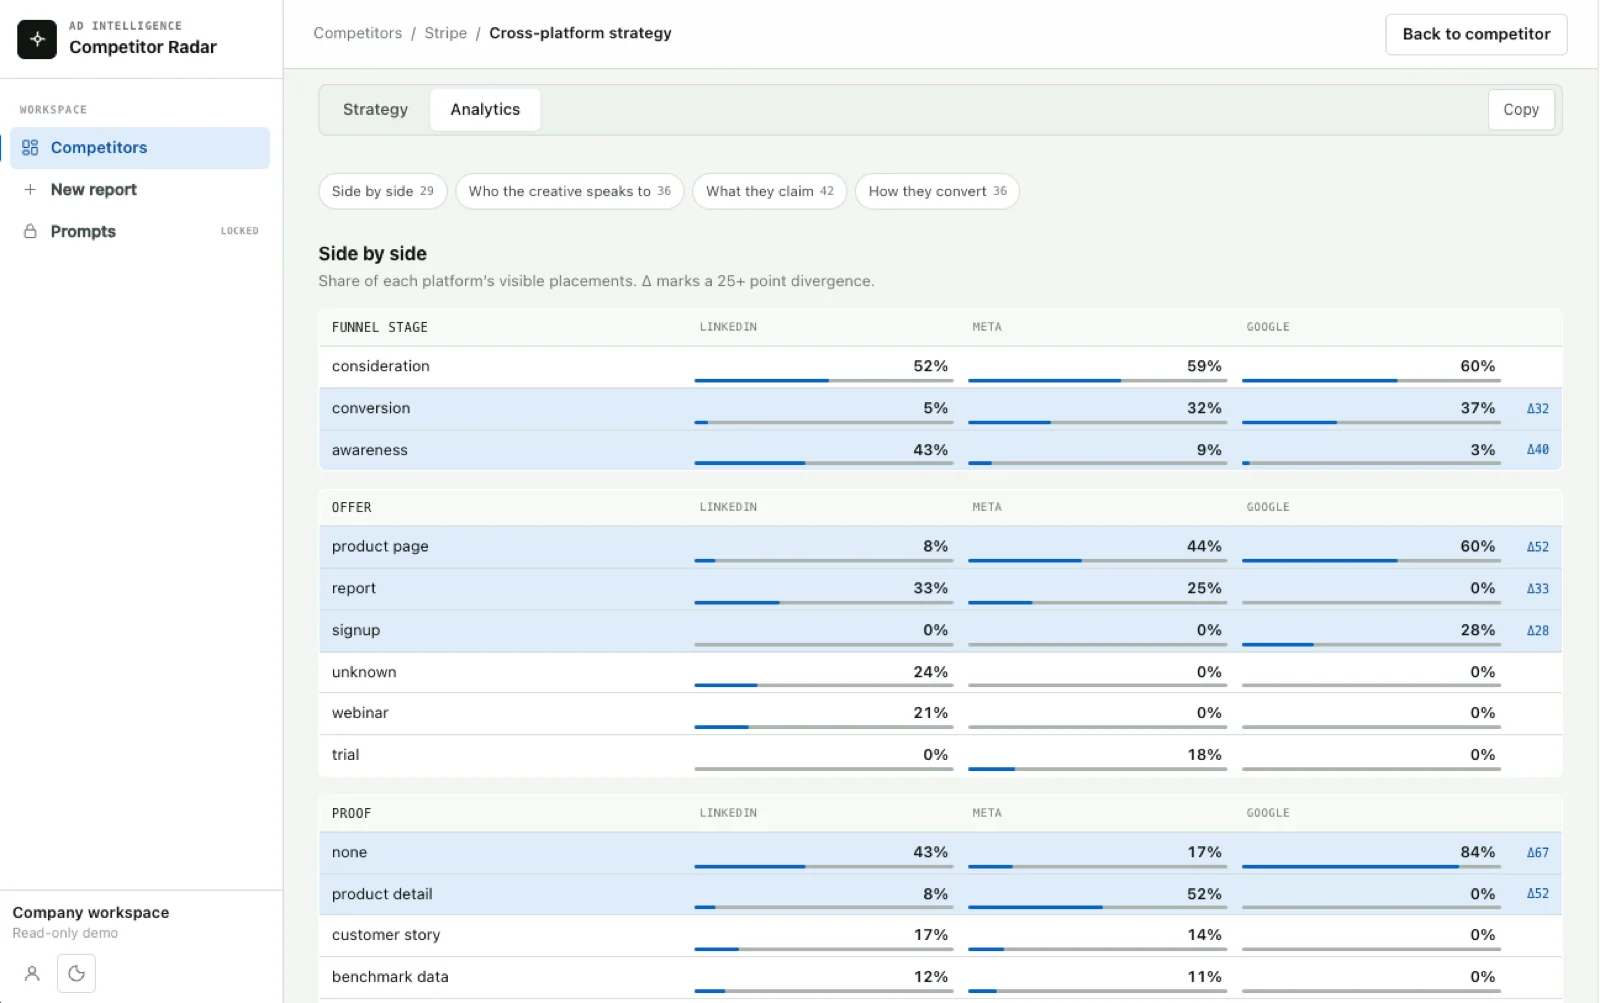
Share of each platform's placements by funnel stage, offer and proof, with a marker on any 25-point divergence so the split is visible without reading numbers.
The audience each platform is written for, which usually gives the strategy away even though nobody states it.
The recurring claims, ranked by how often they repeat. Repetition is the tell for what a competitor believes is working.
Destination and offer: product page, report, trial, signup. Where each platform is asked to close and where it is only asked to warm.
A worked example on Stripe, on the platform that is labeled today: 5% of LinkedIn placements sit at conversion and 43% at awareness. The cross-platform view will read that row against Meta and Google, once their extraction passes are ungated. That single row is the channel strategy, and you would never see it scrolling the ad library.
Every claim walks back down to the creatives it was counted from
I arranged the workspace so the strategy layer never starts from a blank prompt. Context grounds the labels, and the labels feed the pattern read that every response is written from. A quality check at the end says how much of it the evidence carries.
Every layer stays open for inspection. If a claim in the strategy report looks wrong, you can walk back down through the pattern that produced it to the individual creatives it was counted from, and read those in their original form.
Company, category, products, buyers, markets and the competitive frame, written down before any ad is classified.
Public advertising records with creative, copy, active dates, markets, CTAs and destinations, searchable and linked to the original artifact.
It counts every ad across theme, persona, pain, proof, offer, CTA, landing intent and funnel stage. This is where concentration becomes visible.
It names the dominant play, funnel bias, proof system and weak spot, then lists the response options worth testing against them.
It flags missing offer signals, thin landing context and low-confidence classifications before anyone trusts the strategy.
A shared taxonomy holds the layers together, so every ad becomes a comparable record instead of a paragraph of prose. Five groups carry it. Market (persona, industry, geography, pain point), message (theme, value promise, pillar, campaign topic), journey (funnel stage, offer type, CTA, landing intent), proof (quantified ROI, customer story, benchmark data, product detail) and creative (format, hook, visual system, destination). Each ad gets the same fields filled the same way, whichever library it came from. One taxonomy covers every team, so the same report goes to each of them without a rewrite.
Today, one competitor record and a single lookup on the labeled platform
One competitor record now holds all three platforms, the labeled LinkedIn creatives, and the strategy read at each level. It turns "what is this company doing in this market" into a single lookup, and the answer cites the ads it came from.
What that buys for go-to-market is a positioning decision made against evidence: which claims are already crowded, which funnel stage a rival has left thin, and which market they have not bothered to enter properly yet.
Every workflow starts from a decision and works back to the evidence
I built each workflow around a decision, then the evidence it needs. These are the four the tool was designed around.
Map the messages already occupying the category, read the offer and funnel structure behind them, then choose whether to challenge a crowded belief or enter a neglected one. Output: territory, counter-position, proof requirement, first hypothesis.
Baseline a competitor, refresh the evidence set, and review the delta. A refresh matters when audience, message, offer, proof or funnel behavior moved, which is a much narrower alert than "they posted new creative".
Pair format with campaign intent, name the category's proof conventions, then set the test boundary: what should feel familiar enough to read, and what has to be distinctive enough to matter.
Advertising shows the positions a competitor is actively paying to put in front of the market. Measure the repeated beliefs, audit the proof under each, and find the claims with heavy competition and weak substantiation.
A strategy report should show where its certainty ends
Public advertising reveals campaign patterns. It says nothing about account economics or internal intent, and a tool that blurs the two leaves you with a report you cannot act on. So the report separates its three tiers on the page, and the quality gate refuses to publish a confident read over thin coverage.
Python at the bottom, a cheap model in the middle, an expensive one only at the top
I split the stack on cost. Labeling every ad on a frontier model would have priced out the whole-corpus pass, so Python does everything deterministic, the cheap tier takes the volume, and the frontier model only reads a corpus that arrives already structured.
Collection
 PythonThe whole pipeline. No front-end framework, because nothing here is a page.
 PlaywrightDrives a real browser through the three transparency libraries.
BeautifulSoupParses the captured markup into ad records.
PlaywrightDrives a real browser through the three transparency libraries.
BeautifulSoupParses the captured markup into ad records.
 Meta Ad LibraryPublic source for Meta creative.
 Google Ads TransparencyPublic source for search and display evidence.
Models
 DeepSeek, cheap tierLabels every creative and landing page. The price per ad is low enough to label a full corpus in one pass.
DeepSeek, reasoning tierReads one platform at a time and writes the strategy layer over the labels.
Tesseract OCRLifts copy out of image creatives so they enter the same taxonomy as text ads.
DeepSeek, cheap tierLabels every creative and landing page. The price per ad is low enough to label a full corpus in one pass.
DeepSeek, reasoning tierReads one platform at a time and writes the strategy layer over the labels.
Tesseract OCRLifts copy out of image creatives so they enter the same taxonomy as text ads.
Data and delivery
 SQLiteLocal store while a competitor set is being built.
 SupabaseThe workspace database behind the hosted reports.
 ResendReport-ready and access notifications.
 StripeBilling for the hosted workspace.
 VercelHosts the workspace.
Want this kind of tooling on your team?
A rival's public ads, labeled one at a time, read back as traceable strategy.